Hello everyone!
Today we would like to talk about RAID arrays with lost configuration and how to extract data from them. This article will be useful to both digital forensics experts and data recovery engineers. Let’s start with understanding what a RAID is in the first place.
RAID. What is it?
RAID is a Redundant Array of Independent Drives. The system shows it as a virtual storage device with block access. In essence, RAID is a virtual drive.
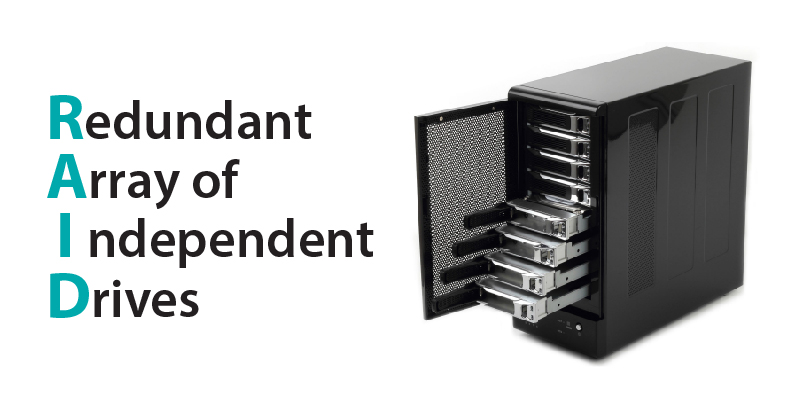
The purpose of assembling RAID is the creation of storage with higher access speed, larger capacity and greater reliability.
Why people use RAID? Domestic users may assemble arrays to create backups or to store their personal archive of photos and documents, along with home multimedia library (movies, music and so on). Companies use RAID as data storage on the server. This can be a common (shared) document storage, storage for backups, databases, accounting data and the like.
In short, RAID is high-capacity storage for the most valuable data.
So how to deal with it?
RAID imaging
There are two ways to make an image of a RAID.
The first one is to get an image on the machine under examination.
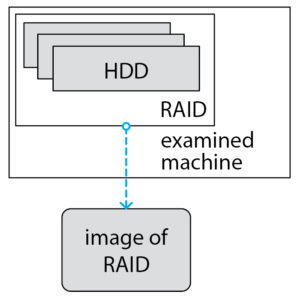
The main advantage of this method – there is no need to understand how the array is arranged. However, this method has many drawbacks and the main one is that doing something on the running examined machine is not good. So, what options are available?
- We may run the server and launch some copying software from USB flash drive or from a Live CD; though the OS may change something during work, which is obviously bad.
- It is possible to boot up the OS from a CD or a flash drive and launch the software – there is no guarantee that it will work, because, for example, many arrays are software ones (including the widespread NAS), so, to see the RAID, you need to run the appropriate software. Also, if we use this method, we will not be able to access areas of the disks that are not used in RAID.
So, in general, we can’t be sure that the data will remain unchanged.
The second approach is to make an image of each drive separately. And then assemble the array in the read-only mode.
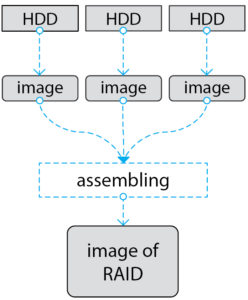
This is the only method that ensures the integrity of the data, and also gives us the opportunity to research all areas of the HDD (RAID may very well not use the entire disk from beginning to end, but only some of its internal segments. Thus, there may be unused areas that can store hidden data).
The main disadvantage of this method is the need to assemble the array, namely the need to determine its configuration. So, to do everything correctly, we need to define the configuration.
RAID assembling
To assemble the RAID, you have to determine:
- which drives are used: sometimes not all disks are used (there may be spare or excess ones that are used for “system”), sometimes there are not enough disks (1 drive might be broken or got thrown away, but the array still functions due to redundancy) and so on.
- the order of drives in the array. Sometimes it reflects the order in which the disks were placed inside the computer, but do not bet on this.
- the RAID level and the algorithm (if it does have one)
- the block size used for striping
- the start and finish LBA used in RAID (drives are not necessarily used from 0 to MaxLBA)
- the delay. The repeat is a common feature of Compaq and HP arrays (HP bought Compaq).
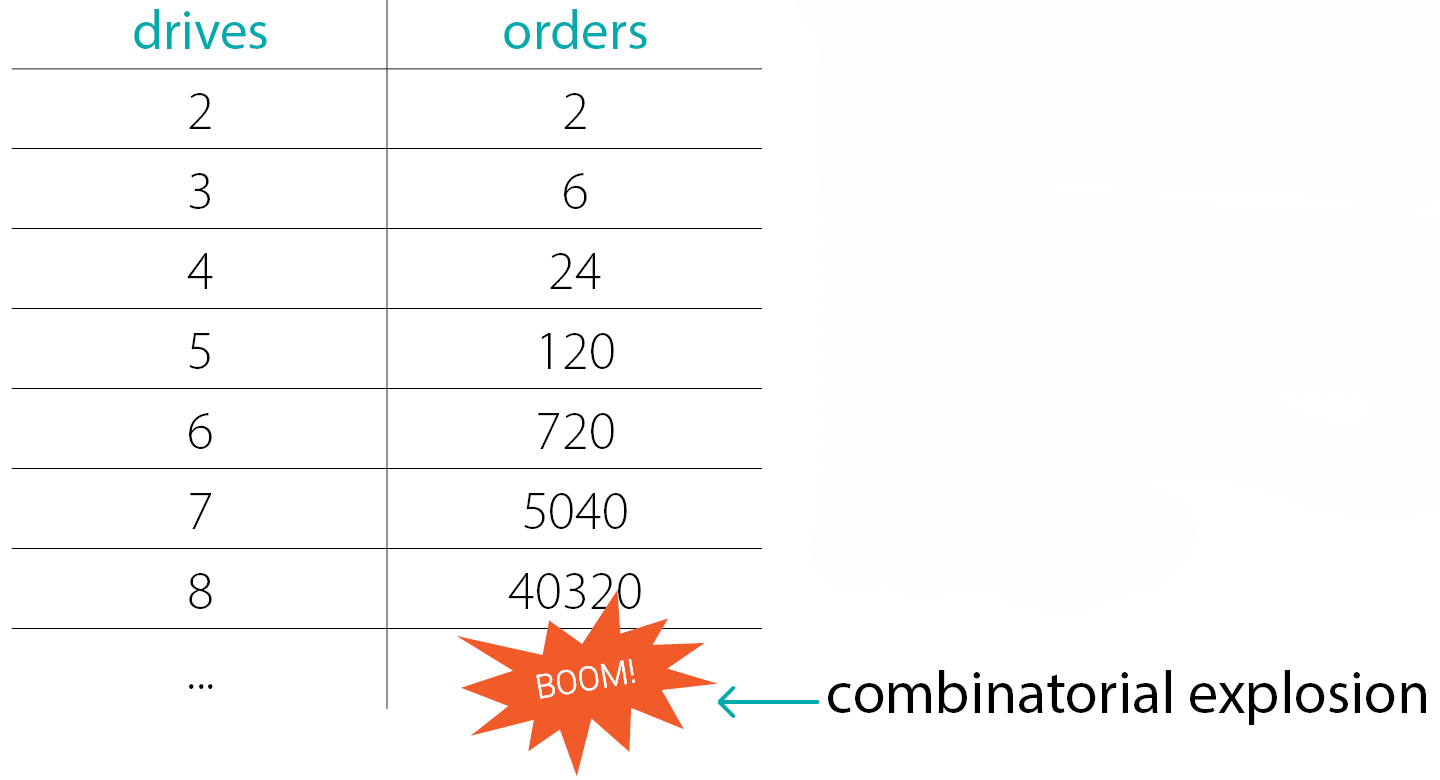
Why the definition of parameters can be a problem? The answer is simple – the number of all possible configurations is huge! Taking only drives’ order gives us 2 dozens of variants for 4 drives, more than a hundred of variants for 5 drives and thousands of variants for 7 drives. And we still have many other parameters that multiply the number of possible configurations.
Of course, there are simple cases, for example:
- software arrays with a well known RAID-metadata format
- a small number of members and simple levels (eg Stripe or Mirror)
All other cases can be really hard for an inexperienced user. Besides, in real life you have to deal with factors that make it extra-complex:
- RAID metadata is missing, corrupted, or incorrect (left over from the “previous” disk life, or is the result of a reinitialization of the array)
- the file system on RAID is corrupted and it is very difficult to use its metadata to define a configuration (the virus or the malefactor could damage FS)
- some members can be unused – it’s hot-spare disks or system-disks.
- another common issue with the members – you may get a bunch of drives from many different arrays. So you will need to understand which disk came from which array first
- the next problem – arrays with exotic configurations, for example, an unusual shift from the beginning of the disk or delay, or whatever else, may be used.
- also, it is often necessary to restore data after a destructive rebuild – the operation of rebuilding an array with incorrect parameters that results in data being damaged (the rebuild itself may be the cause of the investigation)
Assembling RAID during the examination is the necessary action. Even though this task can be very, very difficult.
Keys to success
What can help us to cope with all the difficulties? It is a joint combination of several ideas and approaches:
- the 1st one is a file carving (“RAW Recovery” mode in Data Extractor) with the ability to determine the size of the integer part of the files
- the 2nd one is the statistical processing of the results found by the file Carver. Individual files can give the wrong picture, but their set shows a very good result
- the 3rd one – the ability to quickly check the assumption – for this we need a tool that performs all the transformations associated with the RAID translation or in other words we need on-the-fly RAID reconstructions. Building an image for each assumption check takes a lot of time
Next, we will look at all these things in more detail.
File Carving basics
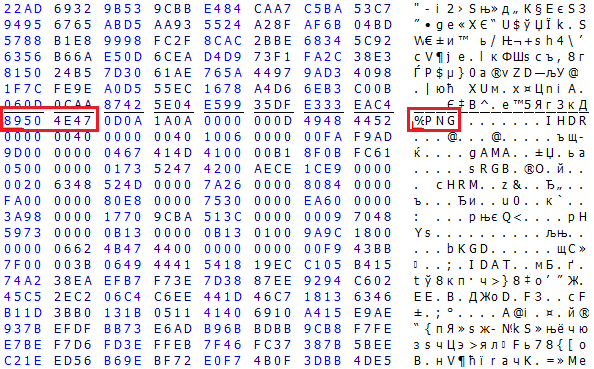
File Carving (“RAW Recovery” mode in PC-3000) is a way to find headers of files using the knowledge of file formats without information from the file system. The simplest and the most commonly used approach is to search for the signature of the beginning of the file. For example, PNG images have the signature “%PNG” at the very beginning of the file. For other file types, the signatures are, of course, different.
Knowledge of file formats allows us not only to find the headers but also to estimate the integer part of the file from below.
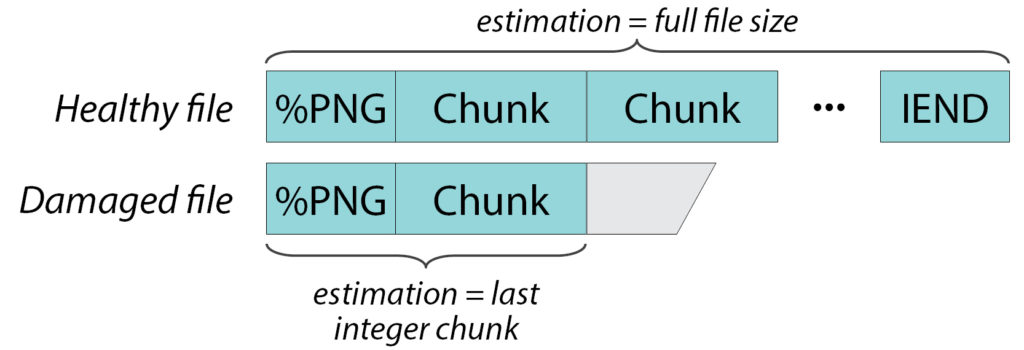
For example, PNG files consist of a sequence of chunks, each chunk having a signature, size, and checksum. I. e. we can verify it reliably enough. This means that if the file is not damaged or fragmented, we can check it from beginning to end and say that it is “whole” and that its size is N bytes.
If the file is fragmented or a part of it has been rewritten or something, then we can say that here is the title and the first few pieces are whole. They occupy K bytes. And somewhere after there is damage. It can be K+1 byte or K+100 byte – unknown. But the first K bytes are exactly whole.
For different types of files, the ability to check the integer part and the accuracy of this check are very different. Where it is possible to check the whole file as in this example from png. And somewhere we can check only a few hundred bytes from the beginning, for example, for BMP files and it does not matter whether it is whole or damaged.
Ability to find headers and check integer parts for many different file types is a unique feature of PC-3000 RAID Systems that no other tool has.
File carving on a RAID member
Let’s look at a simple RAID 5 Left Synchronous (LS) which consists of 3 members. If you have ever tried to recover data from RAID, this configuration should be familiar to you:
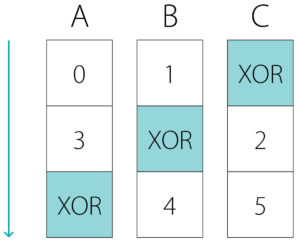
And now let’s look at one of its members, for example, Member A:

This RAID Table describes the repeating rule of translation. The picture shows just 2 full repeats and the beginning of the 3rd. Since it is a RAID member, it stores the data blocks and the redundancy block – XOR. Data blocks do not go one after the other like 0, 1, 2, 3, …, they have gaps – 0, 3, 6, etc. because other blocks are stored on other members.
Now let’s talk about how the file carving works on the RAID members.
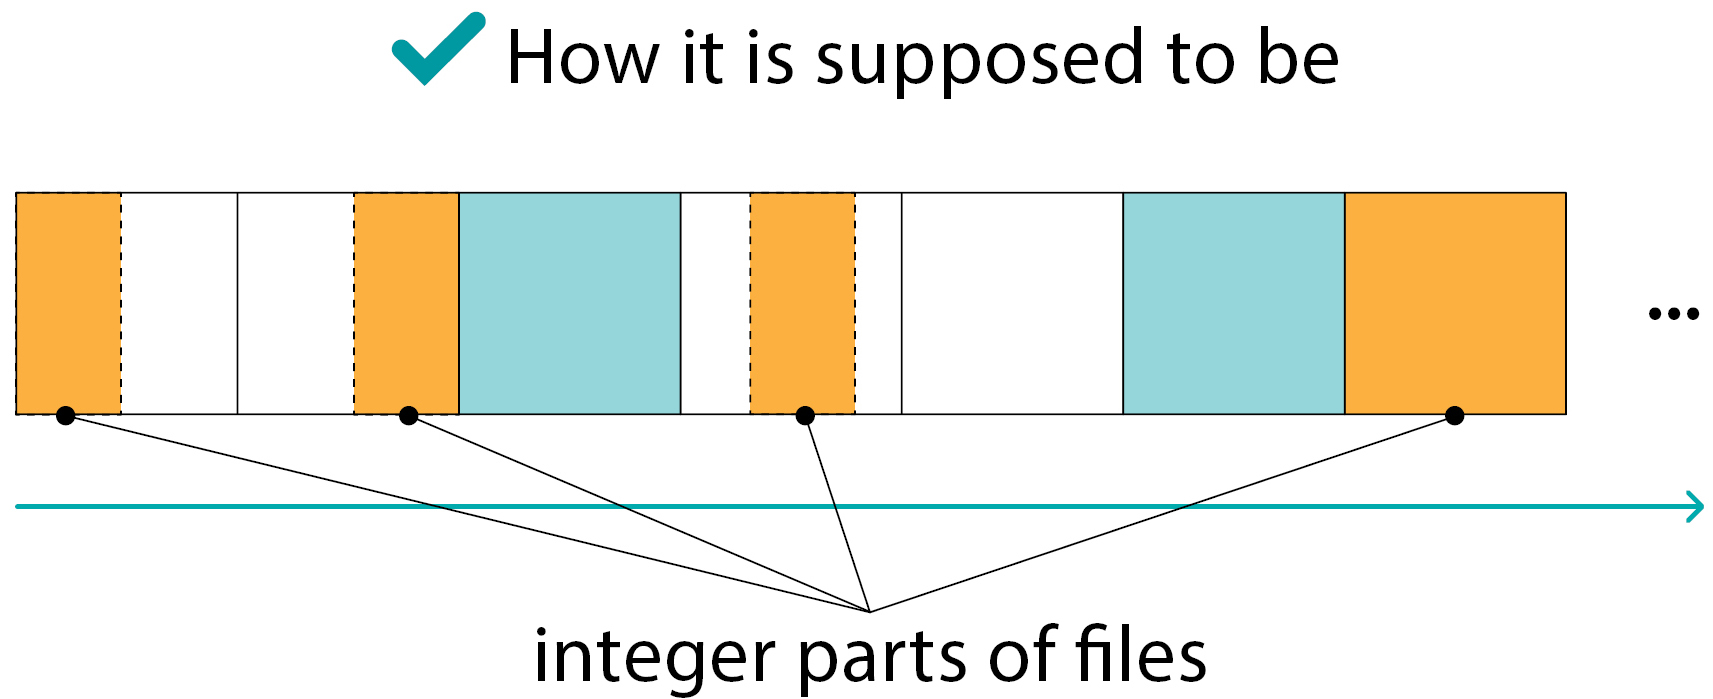
The member stores the individual blocks of the array, thus the integer part of the file is limited by the size of the block.
- the file may start and end somewhere inside the data block
- if the file is large, it will be interrupted at the end of the block since the other part of the file is stored on another member
Here we see the situations the probability of which is extremely small:
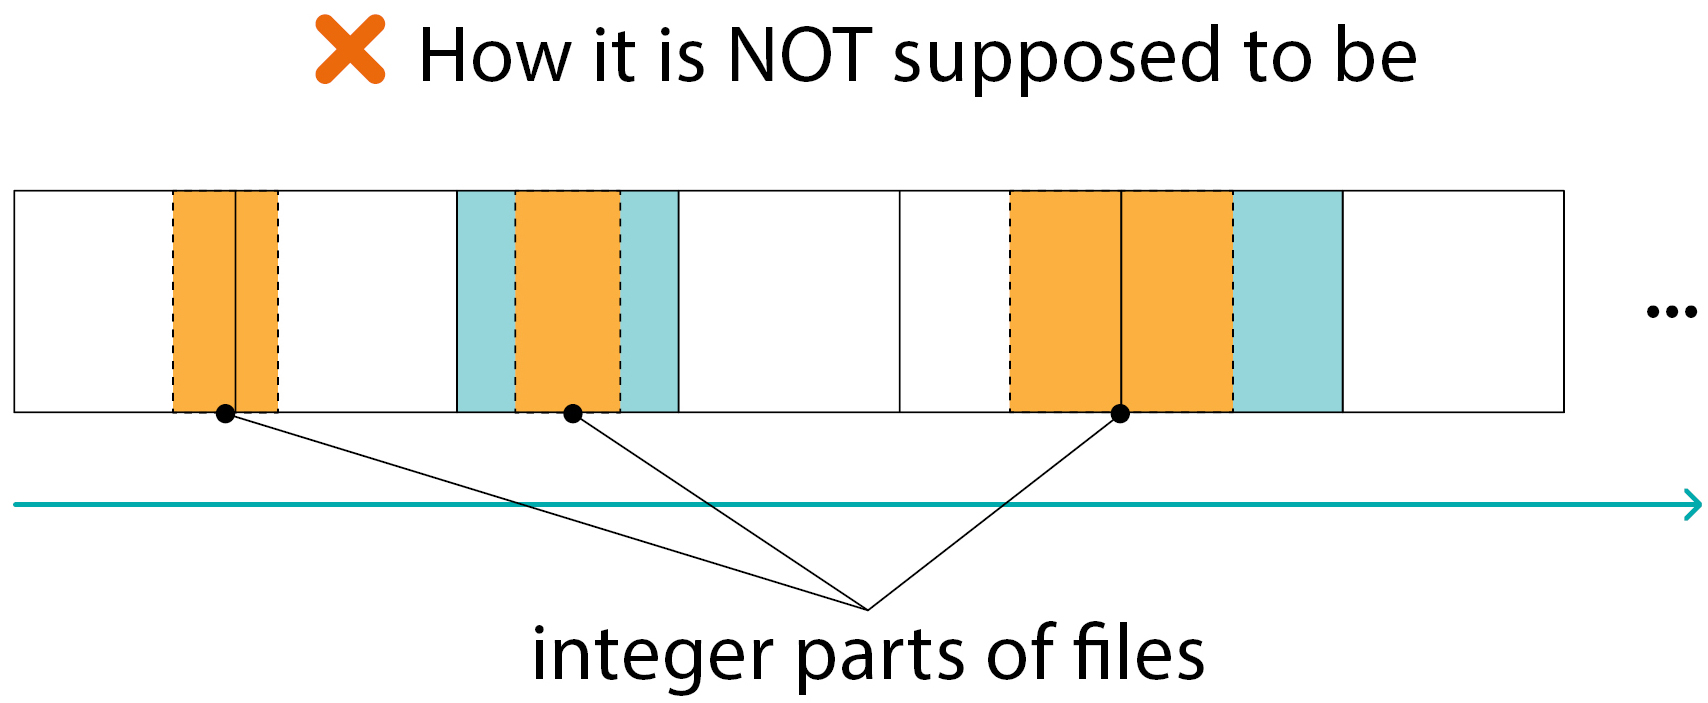
The integer part of the file on a RAID member:
- cannot move from block to block
- cannot be inside the XOR block
Such situations exist of course, but their number is much smaller than “normal” ones (as in the previous slide)
The conclusion is we can find the integer parts of the files inside the individual data blocks only.
Statistical processing of carved data
The rule of data translation in RAID is periodic. In our case, every 2 blocks out of 3 are actually data blocks, and the last one is XOR:
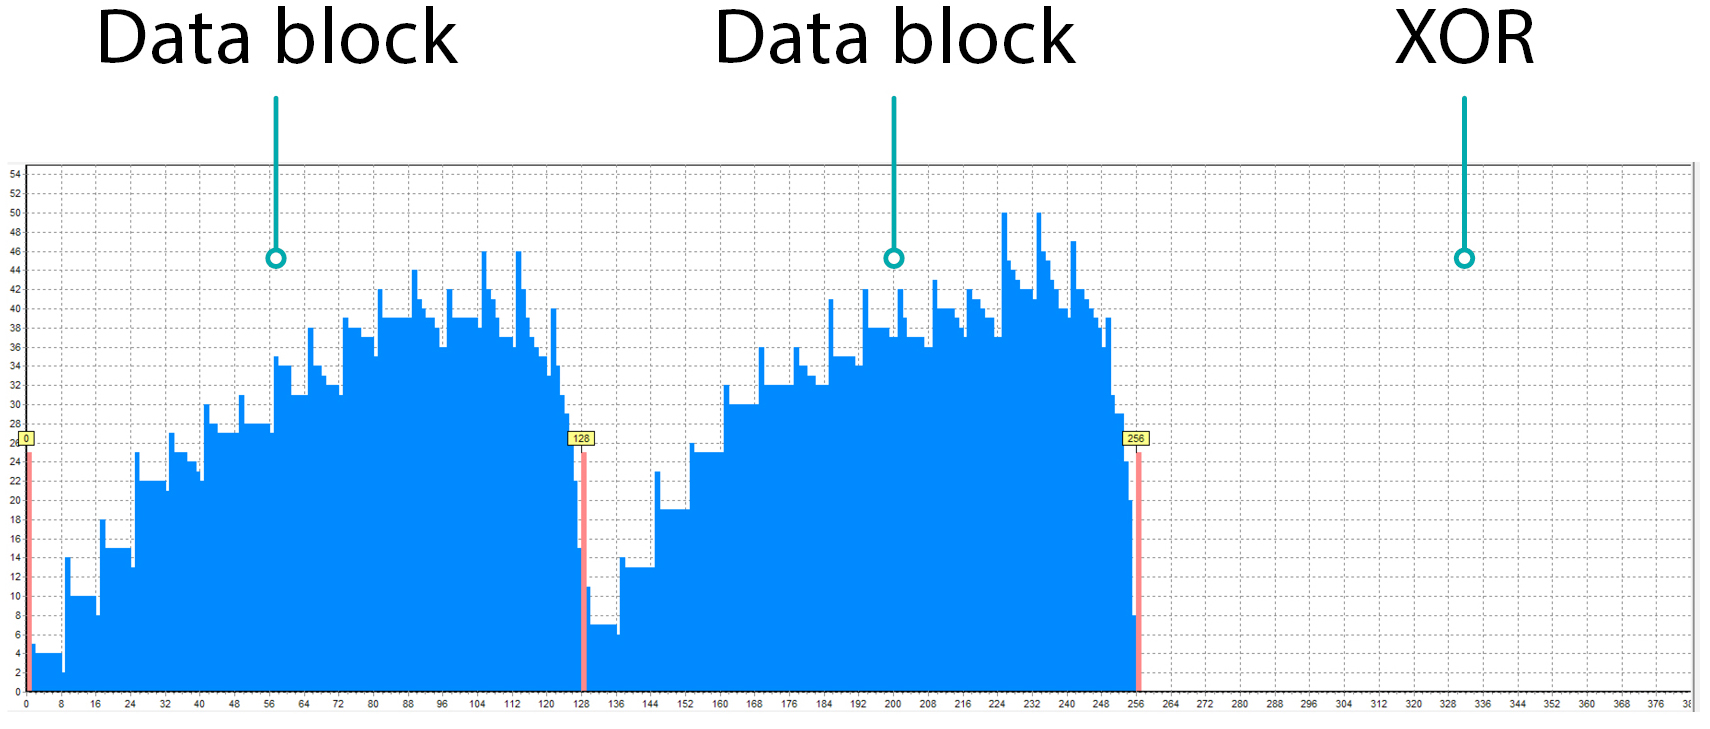
If we just sum up how many integer parts are in each sector of each block, we will see something like this:
- there are a lot of integer parts of files inside the data blocks
- there is nothing inside XOR
- you can see the border between the blocks because the file does not cross the block border
Let’s check the theory on practice. Only PC-3000 RAID Systems have the ability to statistically process carved data and graphically demonstrate the results. In this screenshot, you can see the histogram from the software which was obtained during solving the real case:
The picture is very similar to the previous one. The data blocks and the “empty” XOR block are clearly visible. The red lines show the places where zero and non-zero values are located next to each other. They help to see the potential block borders.
And here are 3 drives at once:
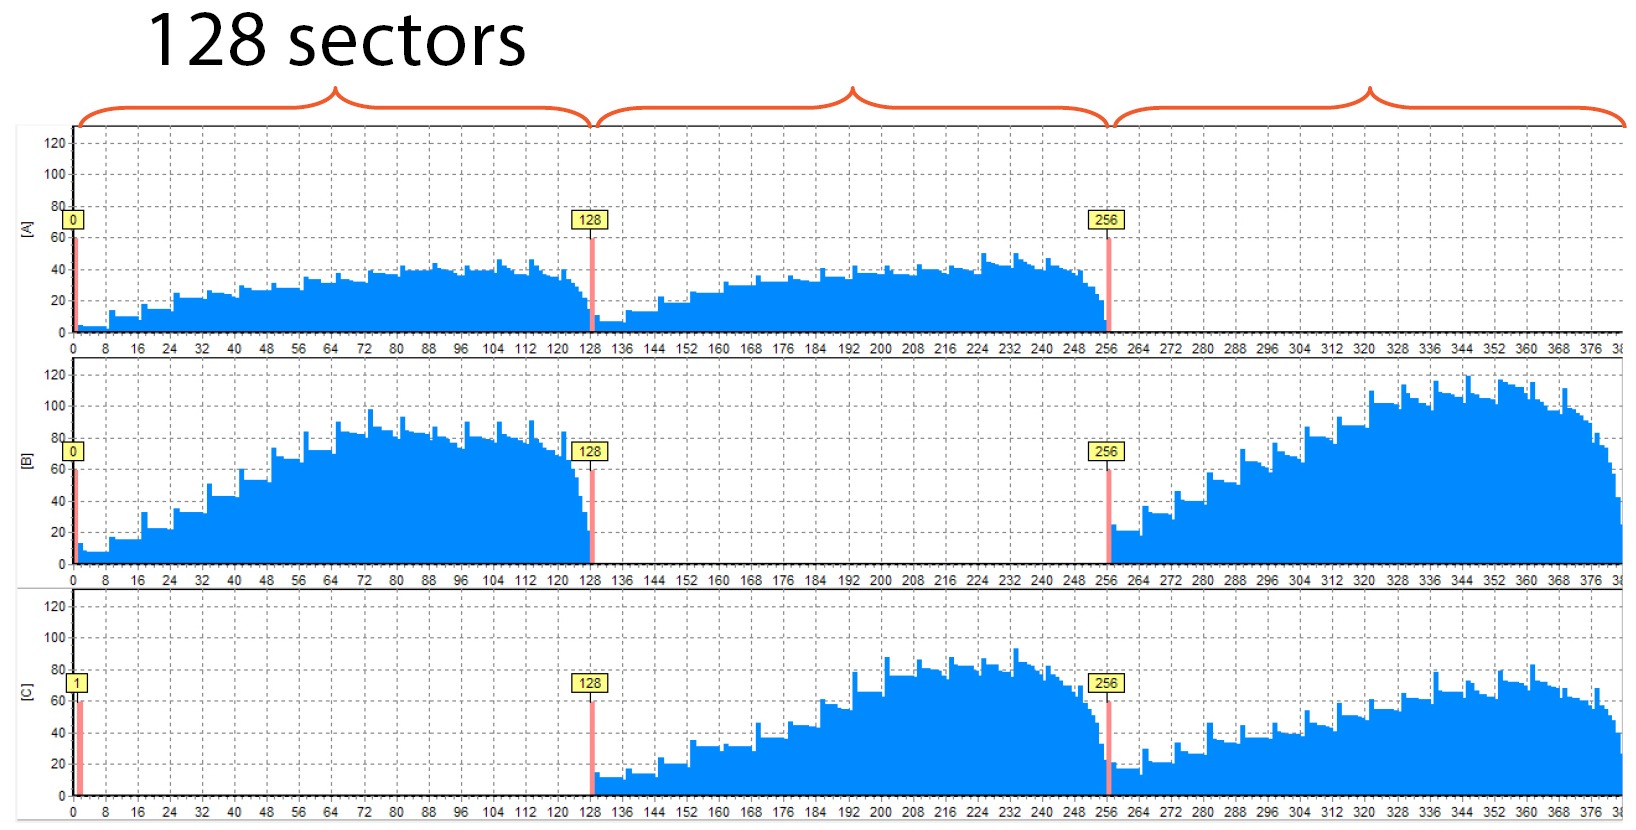
We can see that the XOR block (the “empty” one) is located in different places on different members, as it should be with RAID 5. The block size equals 128 sectors, and it’s shown on the histogram (just do not forget that the LBAs increase left-to-right, not top-down. The thing is it is a more convenient way to view information on widescreen monitors).
Histogram for different periods
The period size is the number of disks multiplied by the block size and delay. So what if we made a mistake? What will we get? Here are real examples of how the histogram of the same disk looks for different periods:
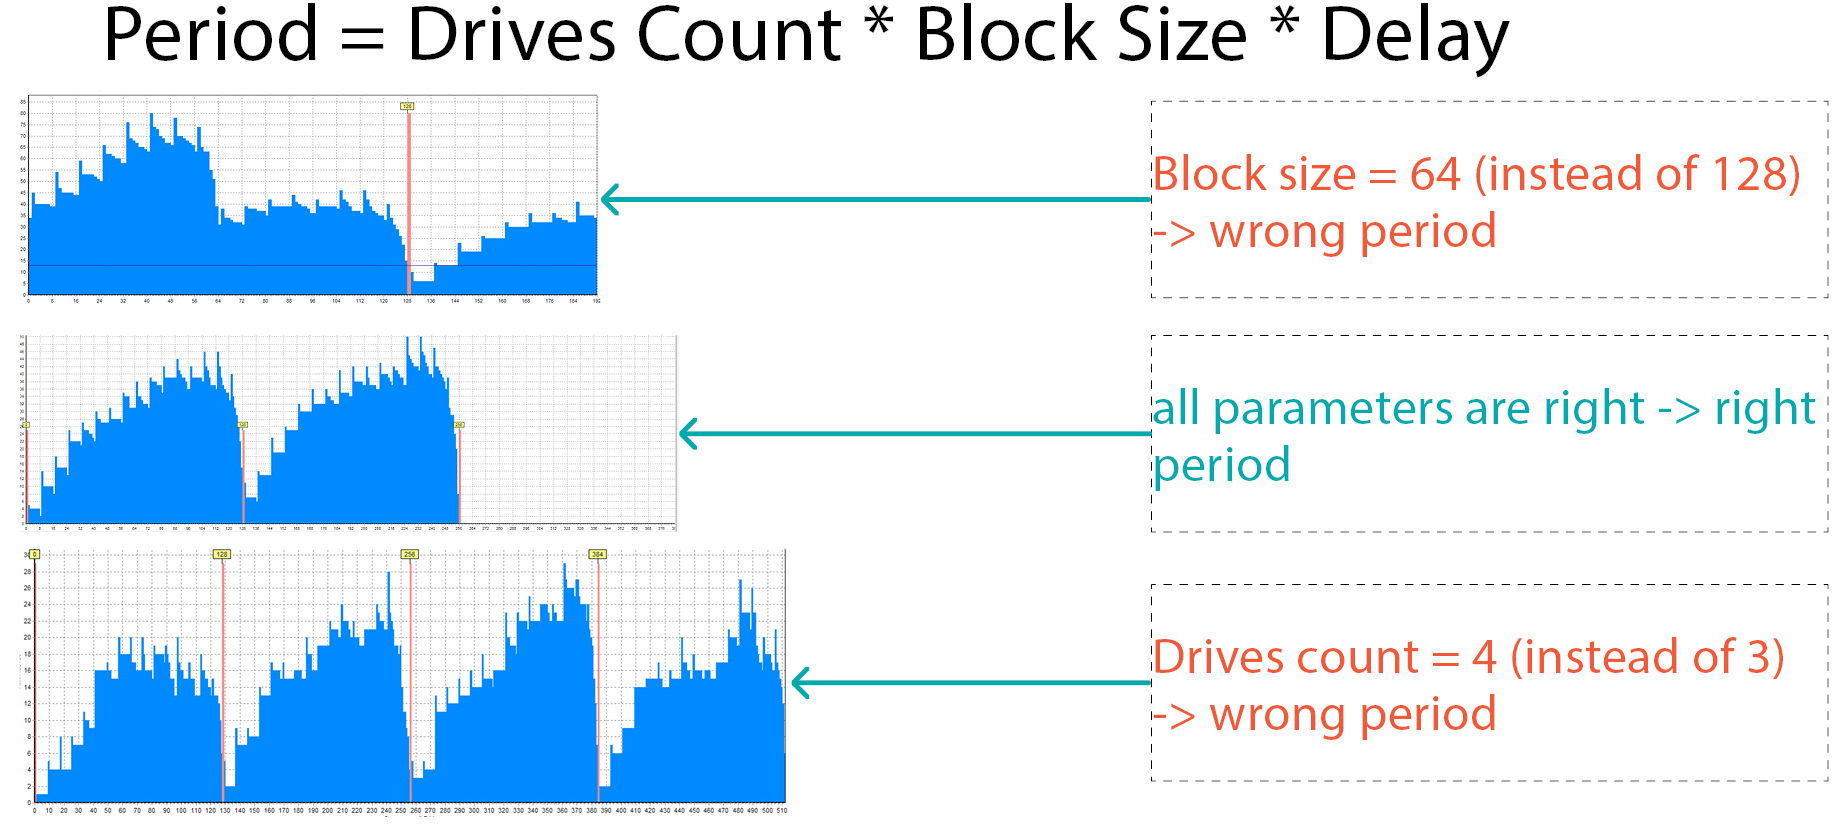
- in the first case, we made a mistake with the block size – we set the size 2 times less than needed and received a period that is 2 times less and it is not clear that this is RAID 5
- the second picture – all the parameters are correct, it is clear that this is RAID 5
- and the last picture – we chose the wrong number of participants – 4 instead of 3 and again we see that the histogram is “broken”
So, if we build statistics with the wrong period, we will see the wrong histogram.
This can be used as a quick histogram test: calculate the period and look at the histogram. If empty areas are visible (as in the XOR blocks) – the parameters are set correctly, if not – this may be a mistake or the configuration doesn’t have any XOR, RS or HS blocks. In real life cases, the histogram is built instantly or in a few seconds. So, it is really a quick test.
Examples of different configurations
Now let’s look into some patterns for different configurations. All histograms on the pictures are based on real cases.
RAID 5, 8 drives, block size 128 sectors
Here you may see the RAID 5 configuration built on 8 drives with 128 sectors blocks size:
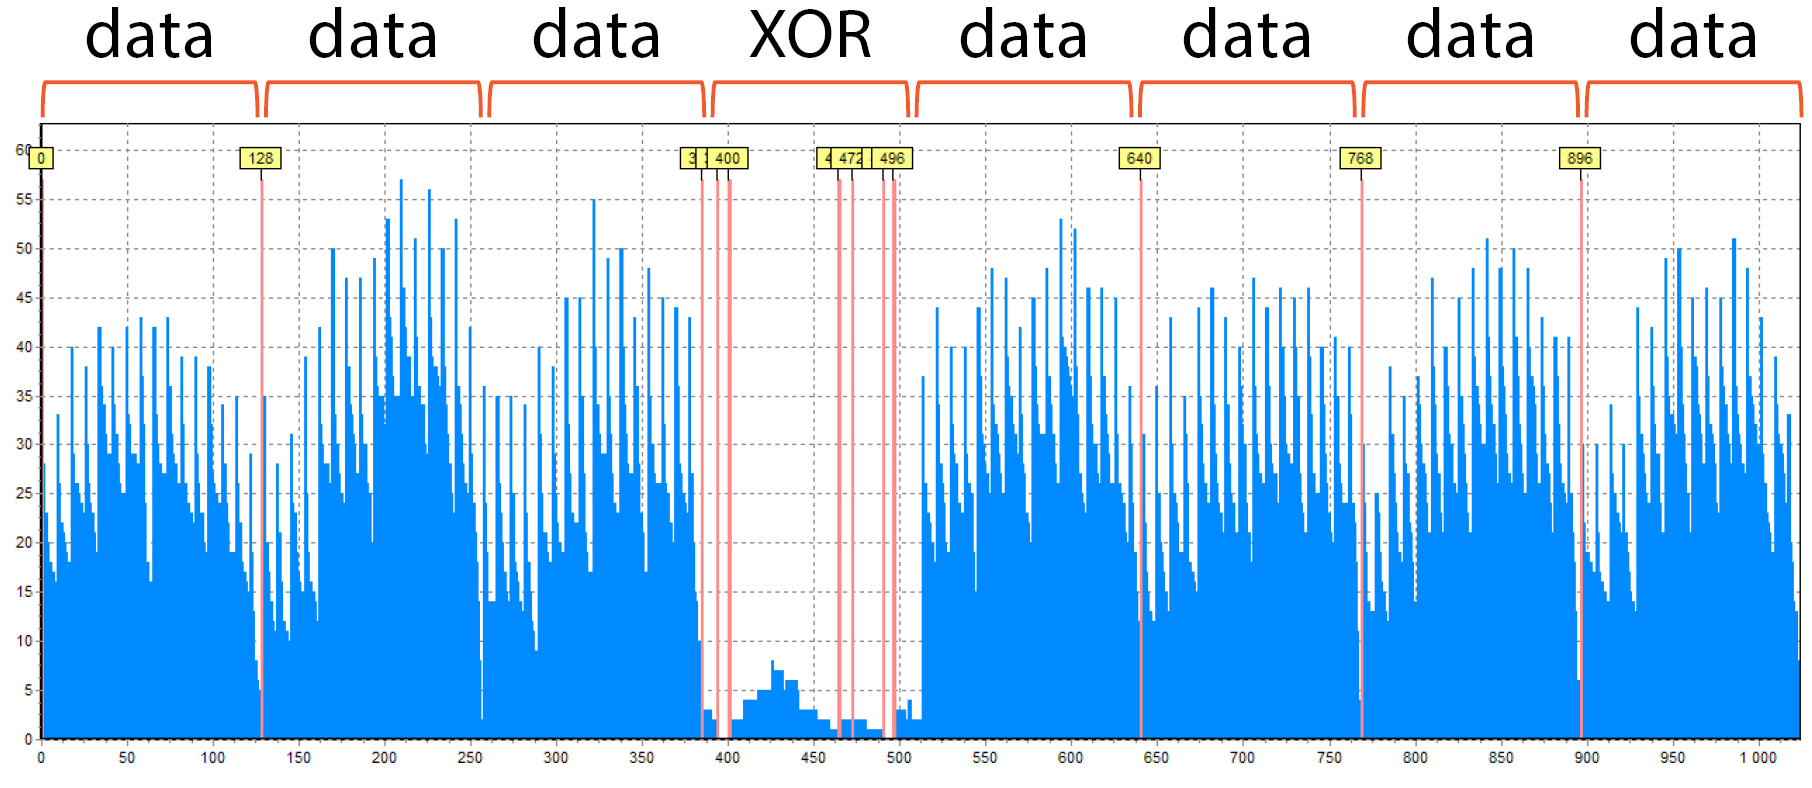
- Why RAID 5? Because it has only one “empty” block – XOR
- Why 8 members? Because the period consists of 8 blocks
- Besides, the 128 sectors block size is clearly visible by the distance between the red auxiliary lines
Also, you can see the “noise” here in the XOR block. Some files were found there, it is not impossible. However, there is a significantly fewer number of them than in the data blocks.
RAID 6 (or 5EE), 6 drives, block size 256 sectors, Start LBA is shifted
And this is the RAID 6 or 5EE which consists of 6 drives:
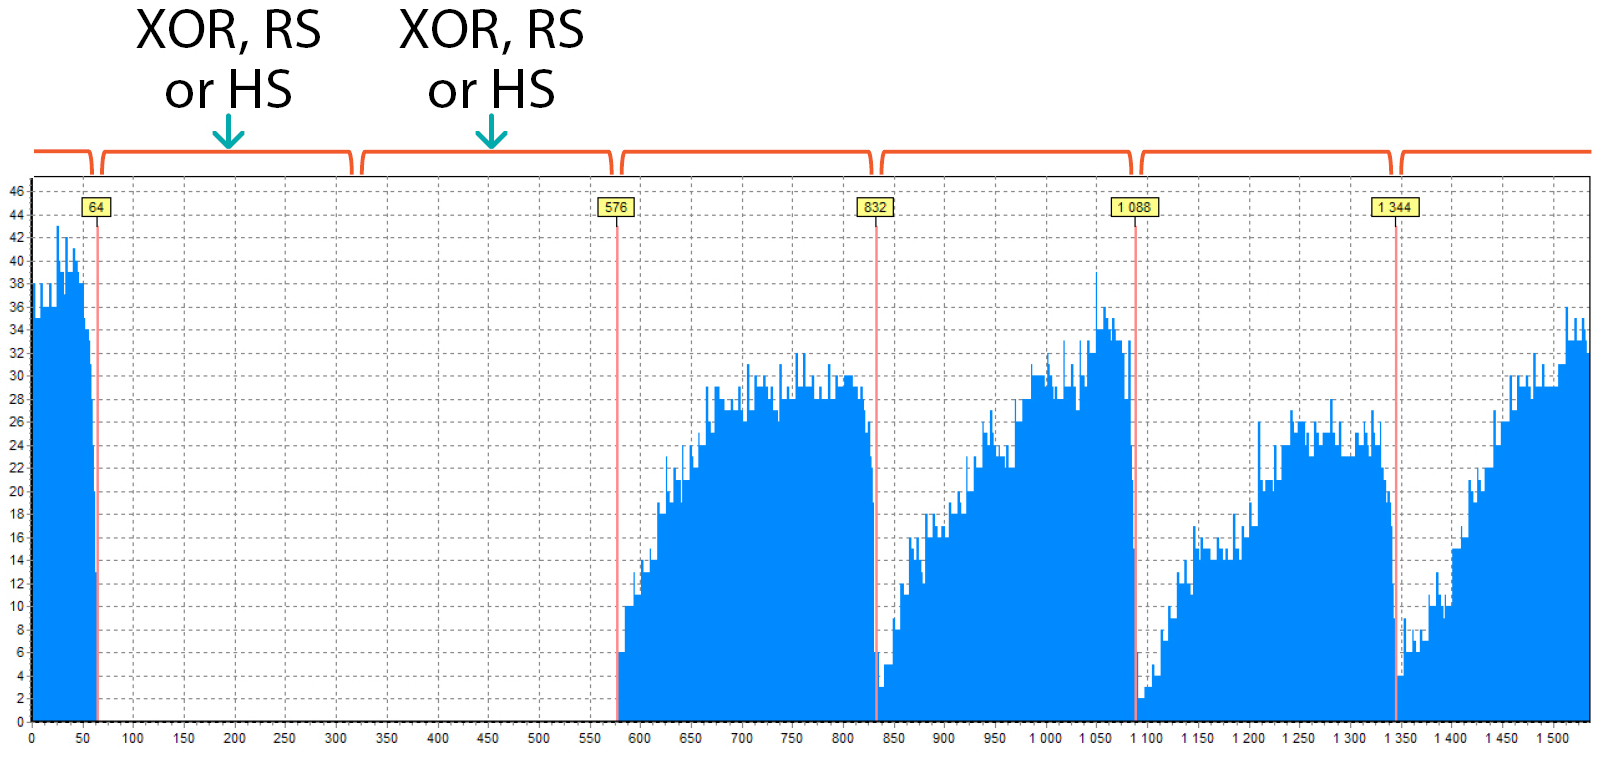
- Why RAID 6? – because there are 2 “empty” blocks. One is XOR, and the other is Reed-Solomon (or a Hot-Spare block, if it is 5EE)
- 6 drives because there are 6 blocks in the period
- the length of one “peak” is 256 sectors, this is the block size
In this picture, you can see that there are 2 parts of the block at the beginning and at the end:
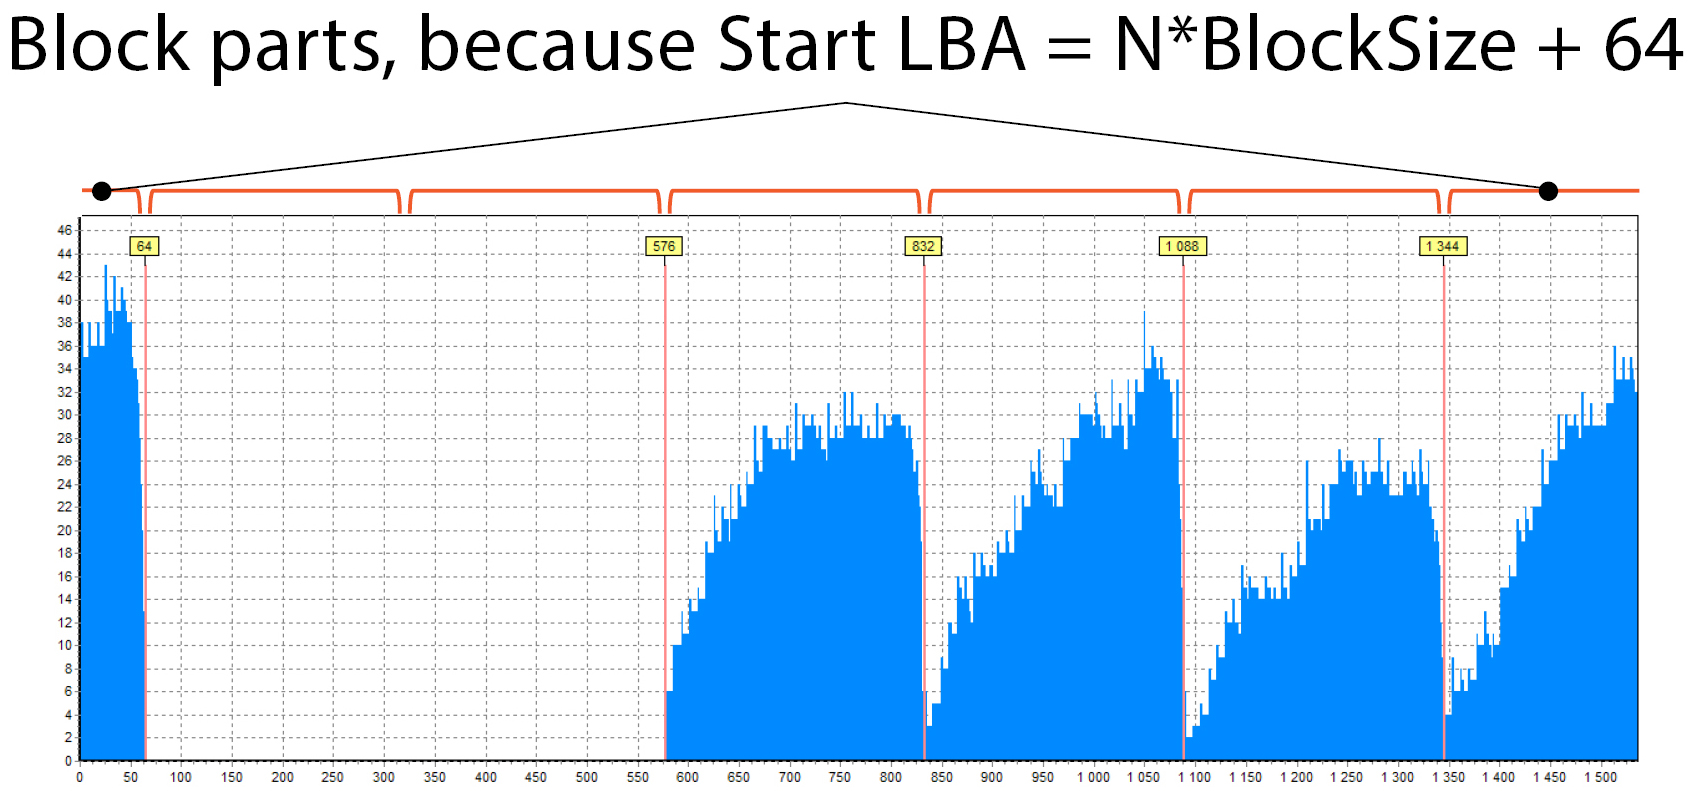
This happens because RAID does not start from 0 as in previous cases, it has some shift. The size of the blue part at the beginning is 64 sectors (there is a hint above the red line). This means that the RAID begins with some LBA, which should be like this: N * BlockSize + 64, N = 0, 1, 2, … . In our case it was 1088 (= 4*256 + 64) – typical start LBA for some HP and Compaq arrays.
RAID 5, 4 drives, delay 16, block size 128 sectors
Here you may see the RAID 5 with delay value equals 16:
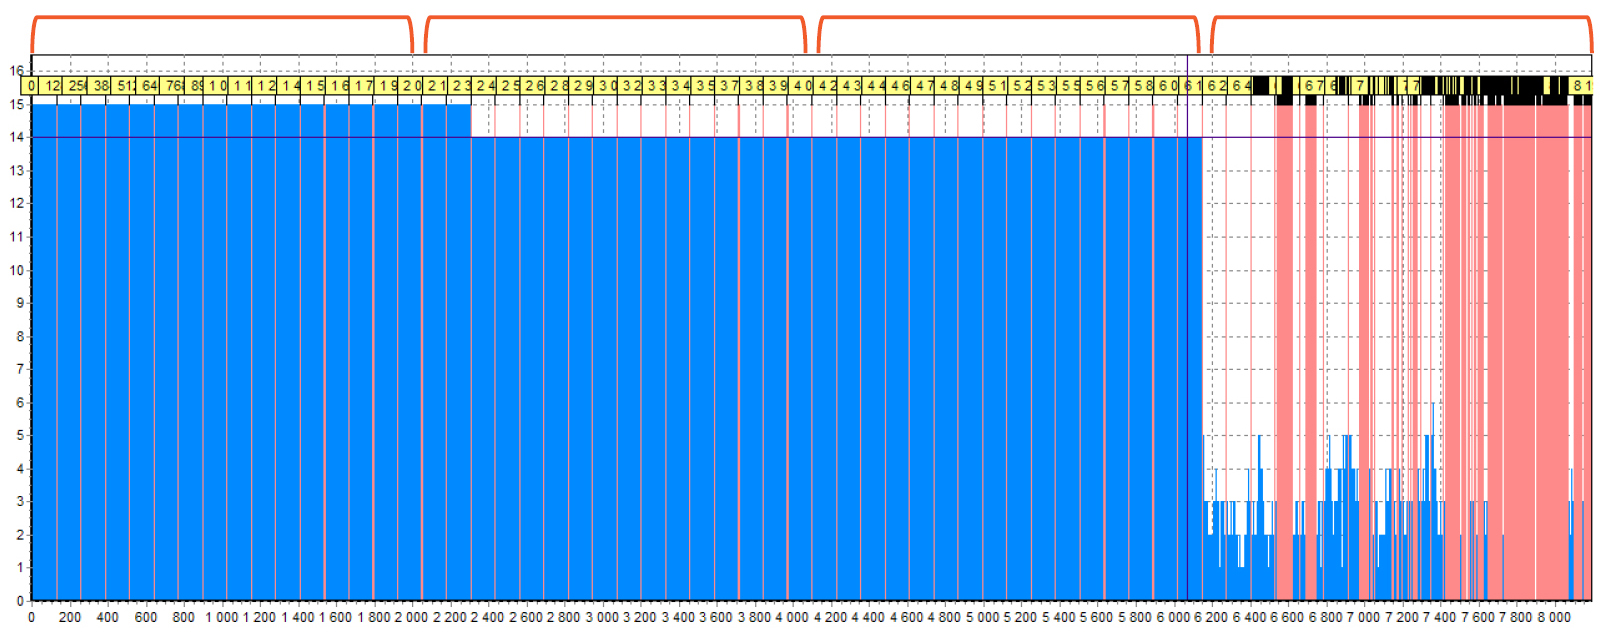
How do we determine this? Here you can see that the rightmost ¼ is an area with service data. There are a lot of red lines – this is the “noise” that creates the small files found in the XOR. In total, we had 4 drives, so we suggest that this is a RAID 5 which consists of 4 drives. (A similar histogram can be seen for RAID 6 which consists of 8 drives). the remaining areas are filled with data, but it is clearly seen that there are many blocks inside one area. Let’s zoom in one of the areas.
Now you can see that there are 16 blocks inside one area:
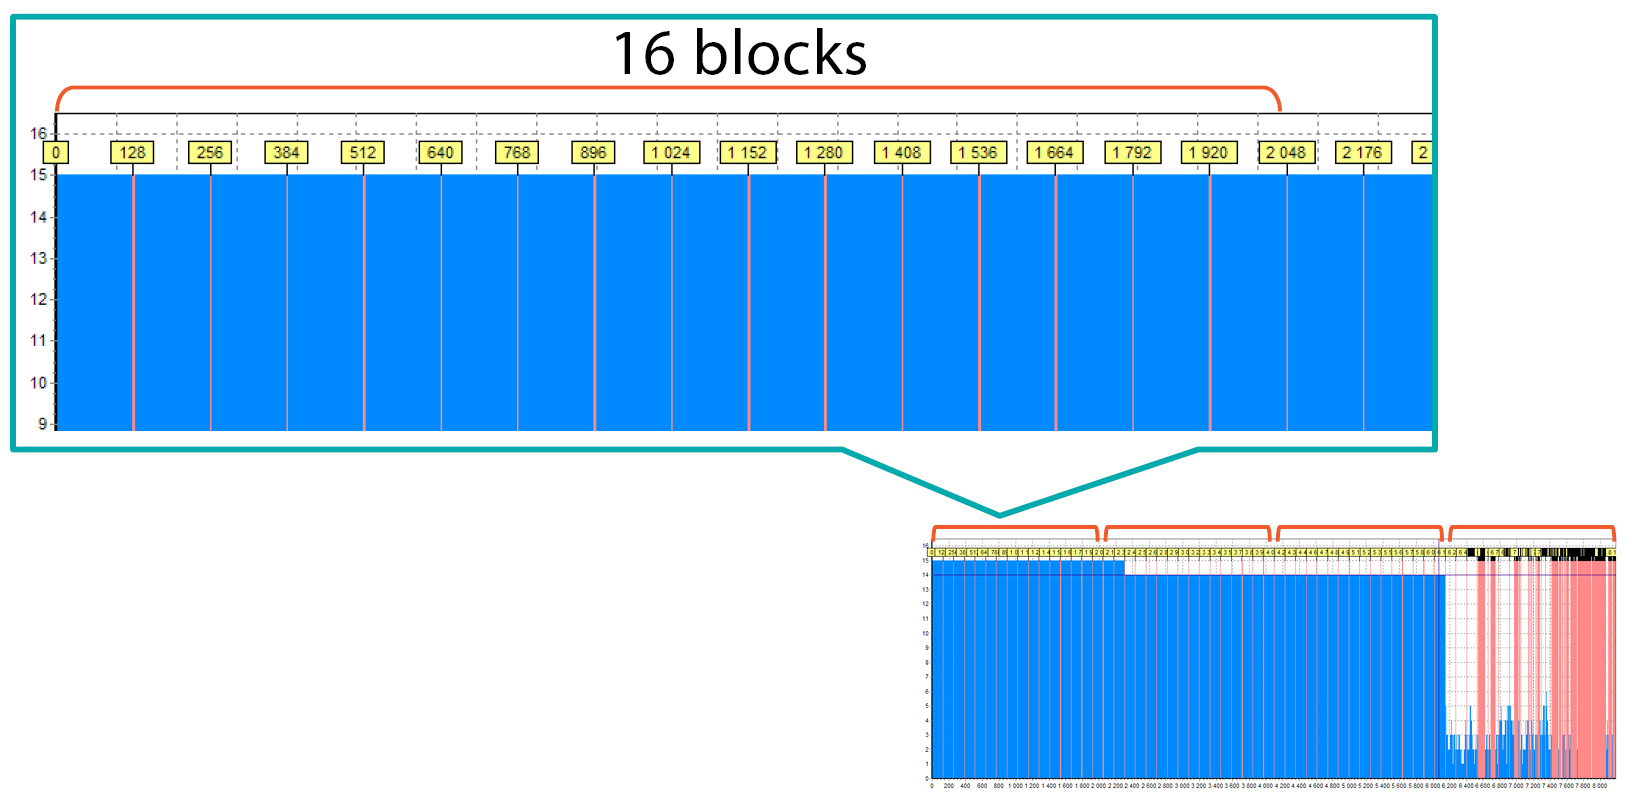
This means that delay is 16 and the block size is 128 sectors.
RAID 0 (or 10 or 1E), block size 128 sectors
And here is an example of RAID 0:
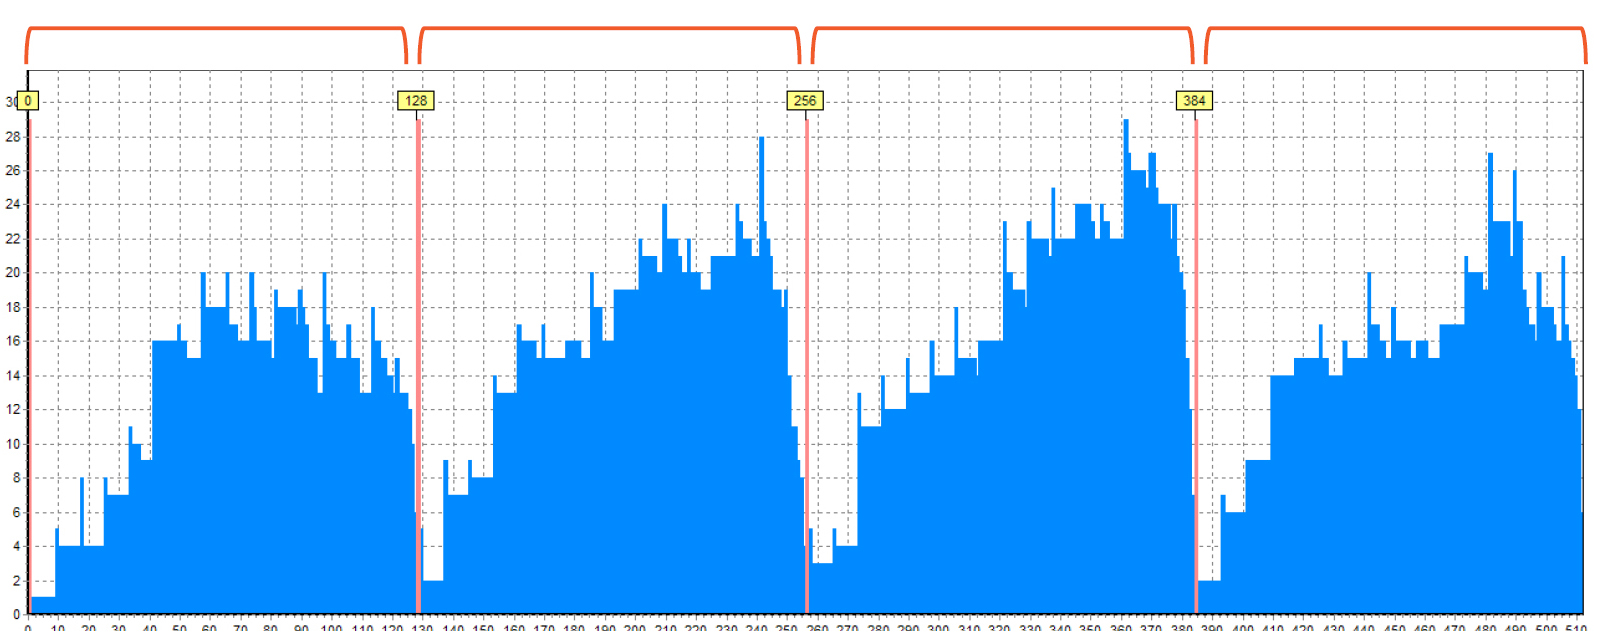
However, the RAID 10 or 1E, or another level if we didn’t determine the right period, will look exactly the same. If you work with this configuration, you should look for histogram for RAID-5 or 6 first. Then we will be able to say that it is 0, 10 or 1E. These levels have no XOR, Reed-Solomon or HS blocks, so we don’t see the “empty” blocks. Besides, we cannot say how many disks are in RAID because we see similar patterns for a different number of drives.
JBOD or non-RAID drive
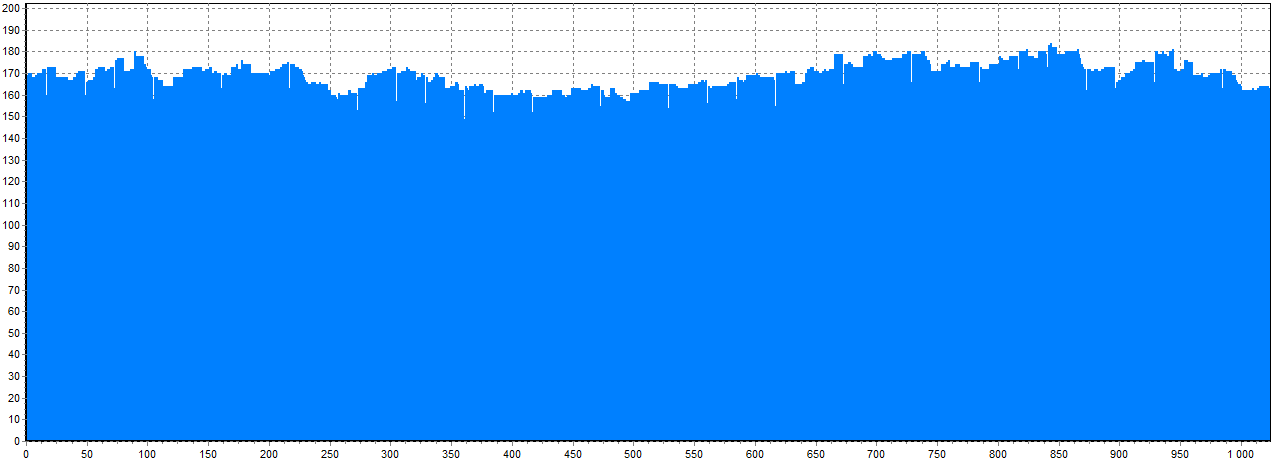
Now see how the histogram for JBOD or just a non-RAID drive looks like. You can see that there are no blocks at all:
One drive is unused and one drive is lost
Unused drives are drives that do not belong to the specific RAID array. It could be spare drives or drives intended to store the OS data.
On the picture you can see that there are 4 drives that belong to RAID 5 made from 5 drives with 512 sectors block size. And the last one is a stranger. Histogram of this drive differs from all other drives. Conclusion: the last drive is unused.
We have only 4 members from 5, so the one member is lost.
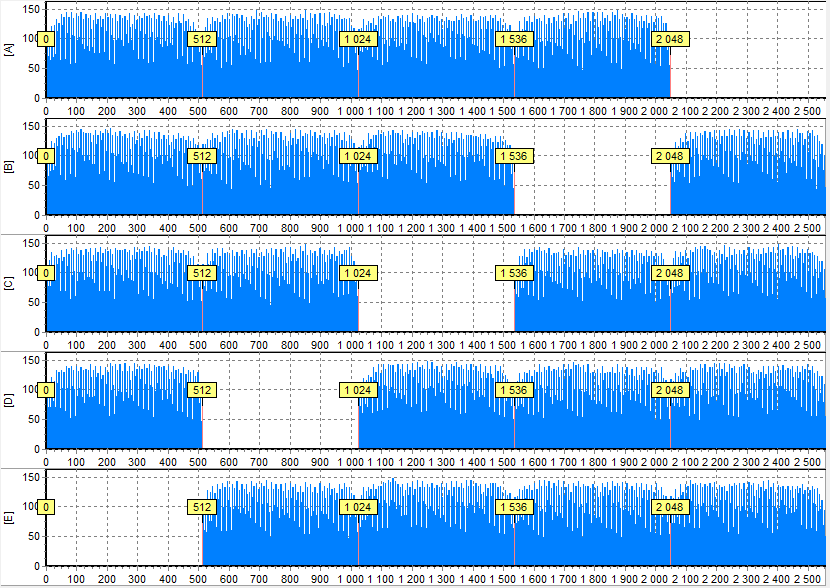
The same idea is for drives from different array – their histograms will differ.
As such, we see that each RAID level has a peculiar histogram which can say a lot about the configuration and can be even called its “fingerprint”.
What can we get from histogram?
Therefore, the histogram alone gives us a lot of information about the array:
- Block size
- RAID level
- Members count
- Delay
- Set of possible start LBAs
- Losted and unused drives
But what about the drive order?
Here is an example of RAID 5 which consists of 5 members and the histograms for all of them. In your opinion, how many drive orders are possible?
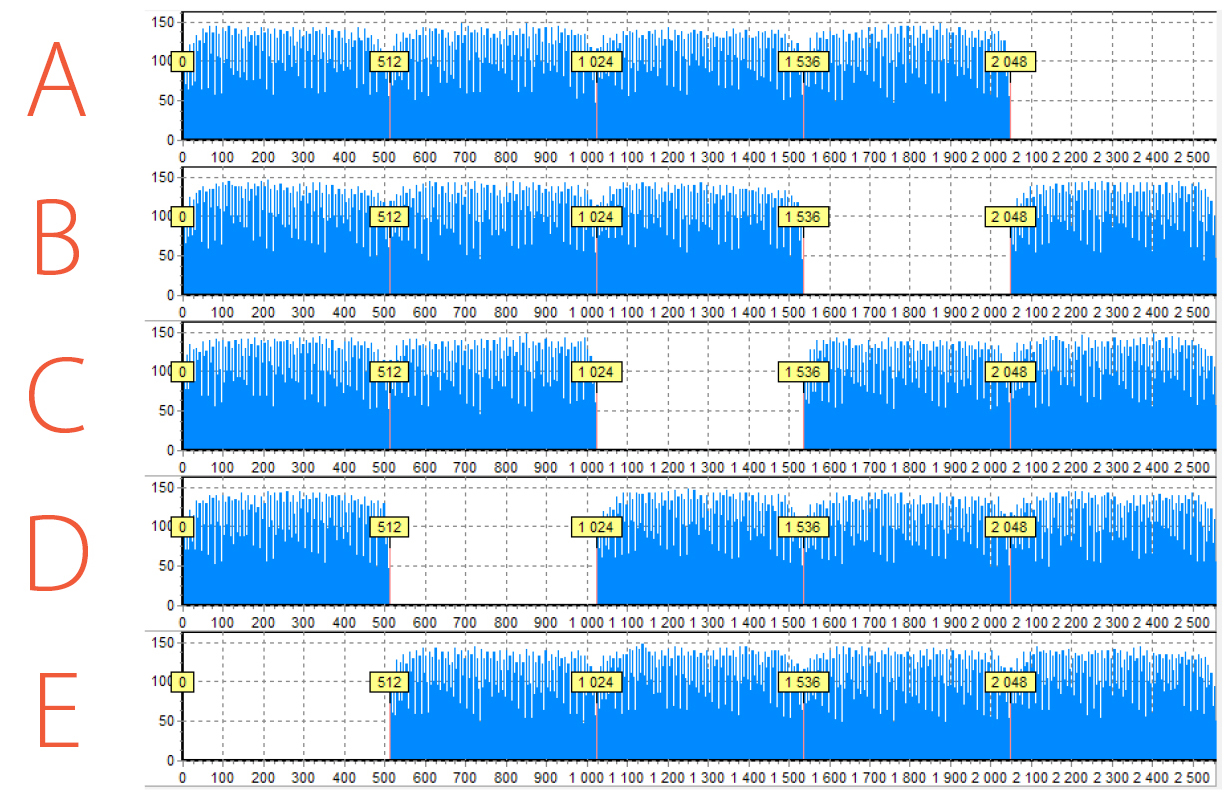
Histograms for all drives allow us to set the XOR diagonal. In total, we have 4 algorithms used in RAID 5. And for each algorithm, we can specify the exact order using this diagonal. Data Extractor RAID Edition has a lot of approaches on how to find the right option and how to check it. We will not go into detail as it is the topic for a separate article. But, in short, the easiest way is to try all 4 options.
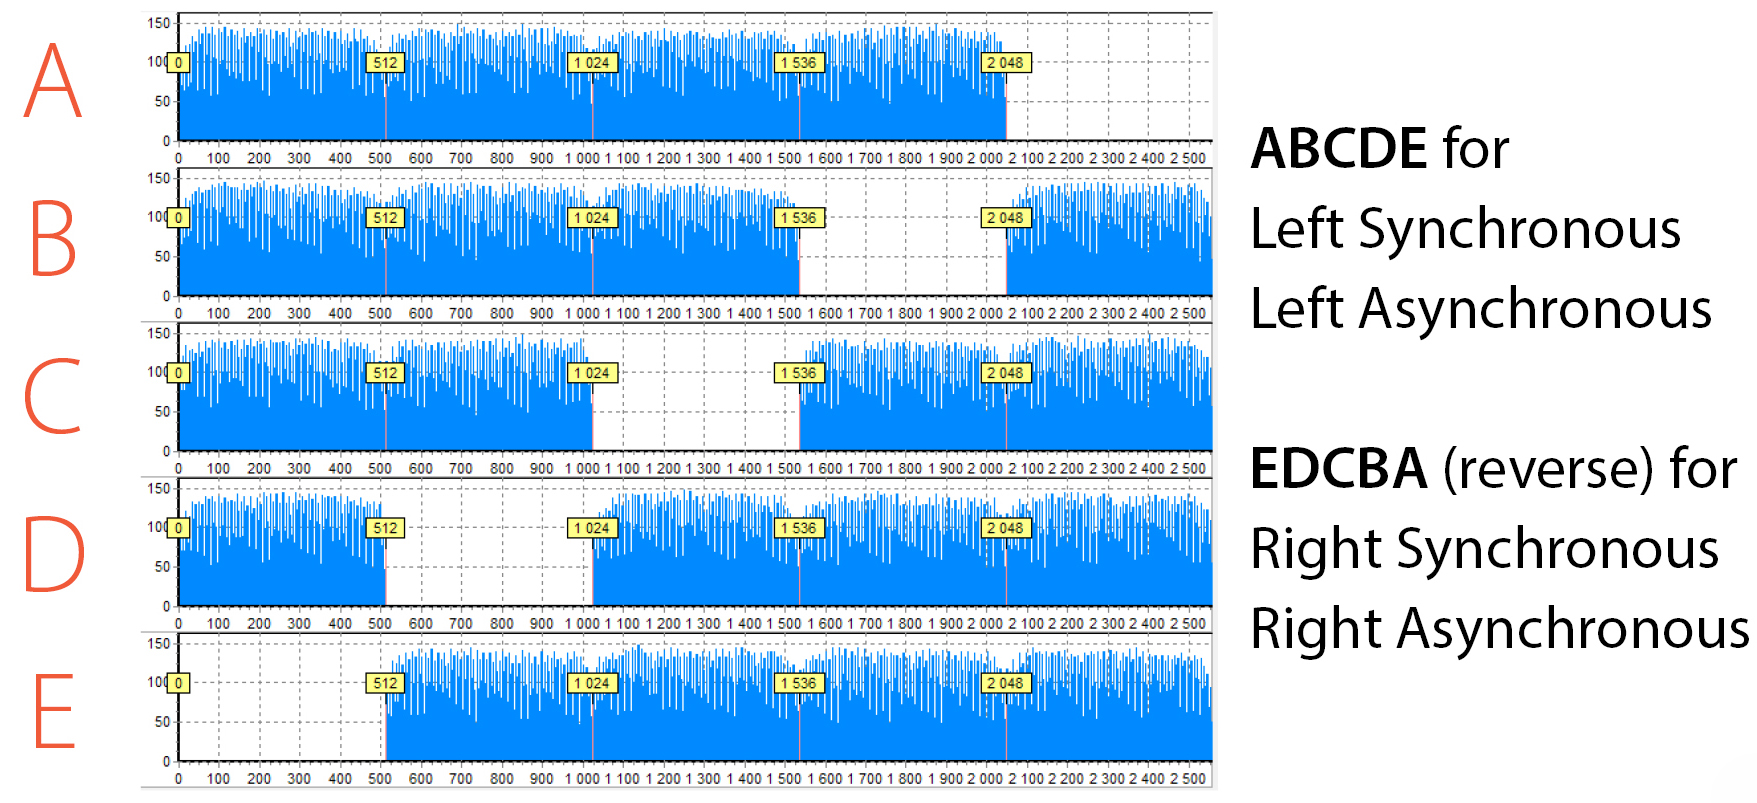
To do this you need to be able to build the RAID on-the-fly and view various configurations instead of making an image for each one. PC-3000 RAID Systems have an ability to quickly change RAID parameters and immediately observe the result. So it will take less than a minute to go through 4 configurations.
The same situation is for RAID 6 and 5EE, but there are few more options – for each algorithm you need to choose which block – XOR or RS – goes first.
To sum up, the proposed approach of using the statistical processing of file carving results – a.k.a. histograms – reduce millions of choices into a few possible ones. In other words, it makes complex RAID data recovery issues simply!
If you have any questions, do not hesitate to contact the ACE Lab Technical Support.


 (3 votes, average: 3.67 out of 5)